《山东大学学报(理学版)》 ›› 2024, Vol. 59 ›› Issue (1): 27-34.doi: 10.6040/j.issn.1671-9352.0.2023.035
范金宇1,2( ),邹杨1,2,熊健3,古勇毅1,2,*()
Jin-yu FAN1,2(),Yang ZOU1,2,Jian XIONG3,Yongyi GU1,2,*()
摘要:
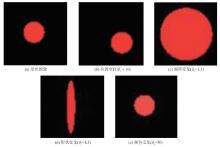
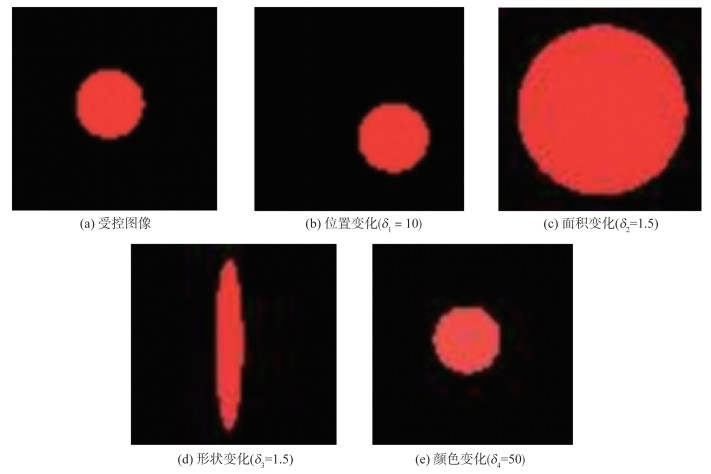
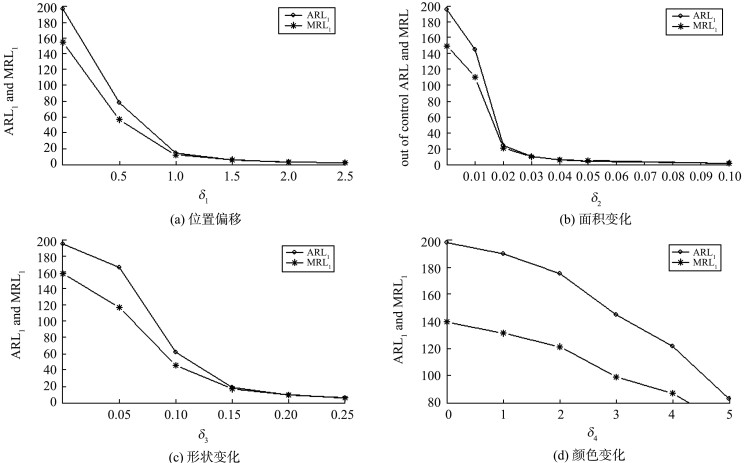
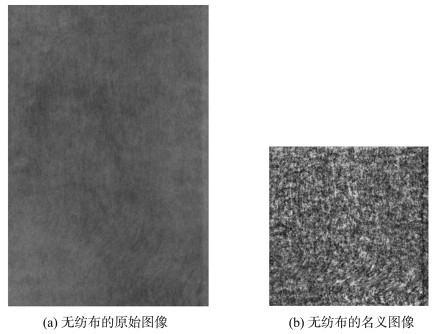
非负张量分解不仅能有效提取图像数据特征, 而且不破坏图像数据的内部结构。因此, 本文基于非负CANDECOMP/PARAFAC(CP)分解建立无需额外参数设置和调优的图像数据控制图, 并基于仿真模拟分析该控制图在不同偏移情形下的监控性能。仿真结果显示, 该控制图对图像的位置偏移、面积变化、形状变化和颜色变化都能做出快速预警。为了比较所建立的控制图的性能优劣, 通过一个实际的工业生产中的无纺布图像, 基于相同的参数设置, 将所提出的非负CP分解控制图与广义似然比(generalized likelihood ratio, GLR)时空控制图、区域增长的指数加权移动平均(exponentially weighted moving average, EWMA)时空控制图和基于实时对比(real time contrasts, RTC)控制图进行比较。模拟结果显示, 当偏移量大于2的时候, 非负CP分解控制图的检测性能媲美现有的检测方法; 当偏移量不超过2时, 非负CP分解控制图能更快速地检测出异常。
中图分类号:
| 1 |
MEOLA C . Infrared thermography of masonry structures[J]. Infrared Physics and Technology, 2007, 49 (3): 228- 233.
doi: 10.1016/j.infrared.2006.06.010 |
| 2 | SEO J J , YOON H , HA H , et al. Infrared thermographic diagnosis mechnism for fault detection of ball bearing under dynamic loading conditions[J]. Advanced Materials Research, 2011, (295/296/297): 1544- 1547. |
| 3 | PASTOR M L , BALANDRAUD X , GRÉDIAC M , et al. Applying infrared thermography to study the heating of 2024-T3 aluminium specimens under fatigue loading[J]. Infrared Physics & Technology, 2008, 51 (6): 505- 515. |
| 4 |
VELLVEHI M , PERPIÑÀ X , LAURO G L , et al. Irradiance-based emissivity correction in infrared thermography for electronic applications[J]. Review of Scientific Instruments, 2011, 82 (11): 114901.
doi: 10.1063/1.3657154 |
| 5 |
NEOGI N , MOHANTA D K , DUTTA P K . Review of vision-based steel surface inspection systems[J]. EURASIP Journal on Image and Video Processing, 2014, 2014 (1): 1- 19.
doi: 10.1186/1687-5281-2014-1 |
| 6 |
YAN H , PAYNABAR K , SHI J J . Image-based process monitoring using low-rank tensor decomposition[J]. IEEE Transactions on Automation Science and Engineering, 2015, 12 (1): 216- 227.
doi: 10.1109/TASE.2014.2327029 |
| 7 |
HORST R L , NEGIN M . Vision system for high-resolution dimensional measurements and on-line SPC: web process application[J]. IEEE Transactions on Industry Applications, 1992, 28 (4): 993- 997.
doi: 10.1109/28.148468 |
| 8 |
TAN J , CHANG Z , HSIEH F . Implementation of an automated real-time statistical process controller[J]. Journal of Food Process Engineering, 1996, 19 (1): 49- 61.
doi: 10.1111/j.1745-4530.1996.tb00380.x |
| 9 |
LYU J J , CHEN M N . Automated visual inspection expert system for multivariate statistical process control chart[J]. Expert Systems With Applications, 2009, 36 (3): 5113- 5118.
doi: 10.1016/j.eswa.2008.06.047 |
| 10 |
MEGAHED F M , WELLS L J , CAMELIO J A , et al. A spatiotemporal method for the monitoring of image data[J]. Quality and Reliability Engineering International, 2012, 28 (8): 967- 980.
doi: 10.1002/qre.1287 |
| 11 |
HE Z , ZUO L , ZHANG M , et al. An image-based multivariate generalized likelihood ratio control chart for detecting and diagnosing multiple faults in manufactured products[J]. International Journal of Production Research, 2016, 54 (6): 1771- 1784.
doi: 10.1080/00207543.2015.1062569 |
| 12 | 何桢, 左玲, 张敏. 基于广义似然比的图像数据监控方法[J]. 系统工程学报, 2016, 31 (1): 127- 134. |
| HE Zhen , ZUO Ling , ZHANG Min . Image data process control based on generalized likelihoodratio[J]. Journal of Systems Engineering, 2016, 31 (1): 127- 134. | |
| 13 |
BUI A T , APLEY D W . A monitoring and diagnostic approach for stochastic textured surfaces[J]. Technometrics, 2018, 60 (1): 1- 13.
doi: 10.1080/00401706.2017.1302362 |
| 14 |
BUI A T , APLEY D W . Monitoring for changes in the nature of stochastic textured surfaces[J]. Journal of Quality Technology, 2018, 50 (4): 363- 378.
doi: 10.1080/00224065.2018.1507559 |
| 15 |
ZUO L , HE Z , ZHANG M . An EWMA and region growing based control chart for monitoring image data[J]. Quality Technology and Quantitative Management, 2020, 17 (4): 470- 485.
doi: 10.1080/16843703.2019.1682751 |
| 16 | 郭晓晓, 李涛. 基于RTC方法的图像数据监控研究[J]. 甘肃科学学报, 2019, 31 (1): 134- 139. |
| GUO Xiaoxiao , LI Tao . Image data monitoring based on RTC method[J]. Journal of Gansu Sciences, 2019, 31 (1): 134- 139. | |
| 17 | KAZEMI S , NIAKI S T A . Monitoring image-based processes using a PCA-based control chart and a classification technique[J]. Decision Science Letters, 2021, 10 (1): 39- 52. |
| 18 |
LOWRY C A , MONTGOMERY D C . A review of multivariate control charts[J]. IIE Transactions, 1995, 27 (6): 800- 810.
doi: 10.1080/07408179508936797 |
| 19 | 王兆军, 巩震, 邹长亮. ARL计算方法综述[J]. 数理统计与管理, 2011, 30 (3): 467- 497. |
| WANG Zhaojun , GONG Zhen , ZOU Changliang . The calculation of average run length: a review[J]. Application of Statistics and Management, 2011, 30 (3): 467- 497. | |
| 20 | STEINER S H , JONES M . Risk-adjusted survival time monitoring with an updating exponentially weighted moving average (EWMA) control chart[J]. Statistics in Medicine, 2009, 29 (4): 444- 454. |
| [1] | 高琦,戴洪帅,武艳华. 基于MPEWMA控制图的串联排队网络的监测与控制[J]. 《山东大学学报(理学版)》, 2023, 58(8): 104-110, 117. |
| [2] | 苏自鹏,袁磊,刘鹏,陈兴蜀,罗永刚,陈良国. 高速网络流实时处理模型研究与实现[J]. 《山东大学学报(理学版)》, 2022, 57(9): 25-32. |
| [3] | 董哲瑾,王健,钱凌飞,林鸿飞. 一种用户成长性画像的建模方法[J]. 《山东大学学报(理学版)》, 2019, 54(3): 38-45. |
| [4] | 陈鑫,薛云,卢昕,李万理,赵洪雅,胡晓晖. 基于保序子矩阵和频繁序列模式挖掘的文本情感特征提取方法[J]. 山东大学学报(理学版), 2018, 53(3): 36-45. |
| [5] | 徐也,徐蔚然. 基于语义特征扩展的知识库增量引文推荐算法[J]. 山东大学学报(理学版), 2016, 51(11): 26-32. |
|